3 Cs of profitable growth - ‘key metrics to 'kill for' or else get 'killed'’
Over the last 6 years, I have had the privilege to work along some of the best entrepreneurial minds in the country - this allowed me to understand what each one of them was doing differently or not so differently. The following post is a summary of my findings on what differentiates successful internet companies from those trying to be successful or those that end up being unsuccessful. By no standards is this set comprehensive and I will continue to add to this - but a 'gun to my head' today the performance on following metrics is dramatically different for successful companies over their struggling or unsuccessful counterparts. And hence, the title of this post - 'Key metrics to kill for or else get killed'.

I have personally observed successful entrepreneurs doggedly define, measure and optimize these metrics for their businesses - they lose sleep over these metrics and have some of their best brains relentlessly run 'high risk - high return' projects to continue to improve these metrics. I would also highlight upfront that each of these metrics, if ignored even for a small period of time can, deteriorate rather quickly resulting in dramatic decrease in growth (read ‘lower valuation’) and increase in burn (read ‘survival risk’) - I illustrate this with a real portfolio experience. On the other hand, setting up these metrics enable early warning signs and corrective actions which often provides competitive advantage in the short to medium run.So without wasting a lot of words, lets jump into the three key metrics - I call them the ‘3 Cs of profitable growth’ – Conversion funnel (%), Cost per lead, Customer Loyalty
Metric I - Conversion funnel (%)
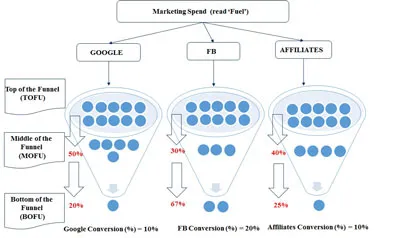
Defining & setting up the conversion funnel (%)- simply defined as the ratio of number of unique customers who complete a desired task (be it a transaction or an interaction like a message or a post) to the number of people who came to the website (or launched the mobile application). The way to visualize this is a funnel (see Exhibit below) wherein potential customers are on the 'top of the funnel' (TOFU), customers drop off at various points in the funnel (for example they could drop before registration, post searching for something or at the kart level etc). Finally, the ratio of the number of converting customers to TOFU customers gives us the efficiency of the funnel. I imagine the funnel to be the company’s ‘growth engine’ with marketing spend for bringing in more TOFU customers being the fuel and conversion (%) being the fuel efficiency - if fuel efficiency is bad, the company will need a lot of expensive fuel (read ‘marketing dollars’) to sustain growth! (more on this below).
It’s important to understand that every acquisition channel (or landing page, or product line etc.) has a different conversion (%) and looking at an overall number won’t paint the right picture. As long as the right form of data is available, I strongly encourage portfolio companies to split conversion (%) across channels (See Exhibit below). In the same breathe, it’s important to understand the user journey through the funnel – as you see below 50% of customers from Google hit the middle of the funnel (MOFU) but only 20% of those end up converting, while FB has lesser number of customers reaching MOFU but very a high % finally converting. Finally, the overall conversion (%) for Affiliates is same as that of Google but customers behave very differently on their path to conversion. These metrics tell us what channels are working and also, what needs fixing to be able to make each channel more efficient (or convert better).

Conversion (%) vary across product / service categories – generally high ticket value, low frequency categories have low conversion – ‘Ugly to Great’ range varies from 0.2% - 5% while low ticket value, high frequency categories –‘Ugly to Great’ range varies from 3% - 20% (if you are anywhere close to the ‘great’ number for your category or are trending towards it please give me a shout now!!)
Impact of low conversion (%) – so what happens in the real world?
A low conversion (%) means that in order to grow the company needs to push more for more TOFU customers. Three things can happen from here -
(1) Company continues to spend heavily on marketing to bring more TOFU customers and in the process burns much more capital than estimated - fund raise timelines are advanced - negative surprise for internal investors - find it hard to raise capital at the desired valuation- perfect conditions of a down / flat round (or maybe shut down)
(2) Company cuts marketing spend which means growth slows down (in the hope of longer run way) - unit economics are still not in place - perfect conditions of a down / flat round (or maybe shut down)
(3) CEO attributes slowing growth to conversion (%) and not to marketing spend. The company changes gears to invest in product and also, drive TOFU customer acquisition through organic channels. Investment in product, over time, drives higher conversion (%) which results in capital efficient (read ‘sustainable’) growth (More on this below – ‘Optimizing the funnel’ & ‘How a portfolio company managed to recover from a drop in conversion (%)’)
Scenario (1) & (2) is where I have observed 95% of the companies land up once conversion (%) falls! - this is simply because Scenario (3) requires a lot of effort and sacrifice but results in highly capital efficient growth in the medium to long run (more on this below).
Different types of funnels - there are multiple funnels that a company defines, measures & optimizes - I encourage portfolio companies to build as many as possible, understand their impact, prioritize and optimize. While this can be painful in the early days for a startup but the clarity it brings to the growth engine and identifying key challenges becomes super easy and fast (read ‘competitive advantage in the short run’). Following are some key examples of funnels -
- New customer acquisition funnel - defined as the ratio of new customers acquired to total potential customers, this funnel defines the efficiency of acquiring new customers and is an integral lever for controlling customer acquisition cost
- Landing Page funnels - funnel helps understand the conversion by landing page - which page is performing and why?
- Hiring Funnel – measures the company’s ability to higher high quality people. Ratio of Number of engineers who joined to total number of engineers interviewed or responded for an interview can be a key metric for HR / CEO to measure brand among potential employees.
Optimizing the funnel - this is a topic which needs a separate post (read 'actually another book'). There is enough and more research out there on the internet on how to do this but following are my two cents based on how I have seen entrepreneurs tackle this (1) Identify where is the customer falling off in the funnel (2) Try and get his details (provide incentive to share email / phone number) - beg them to give feedback - what went wrong? Following are some examples of customer feedback and how entrepreneurs have tackled the same - lack of trust (provide for social ratings & rankings), lack of enough information (personalize information and user journey based on previous and live interactions), Understand customer 'WoW' factor (this will be different for different types of customers) and dramatically cut time to reach there. (3) Incorporate key learnings in the product - Rinse, Lather, Repeat !
How a portfolio company managed to recover from a drop in conversion (%)
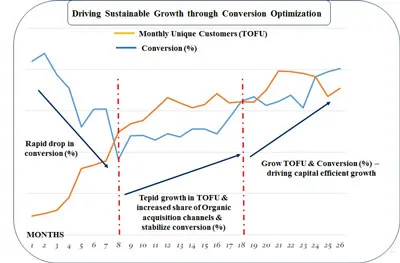
Following is a real world example from a portfolio company which slipped on conversion metrics as the traffic scaled – see Months 1-8 in the graph below. The CEO was quick to attribute the problem to falling conversion rates (a lot of companies pump marketing at this point! – read ‘Disaster’). He quickly changed gears to do two things (1) Took the pedal off paid acquisition (he actually reduced paid marketing spend!) and pushed the growth engine to increase TOFU through organic channels with heavy SEO investment. (2) Understands customer fall off points in the funnel and plugs them through better product experience. Till month 18, the company has recovered fair bit in conversion (%). Month 18-26, the company is able to increase both TOFU and conversion (%) at a rapid pace. Outcome -the company grew 10x in a super capital efficient manner – this is crazy hard to do as it requires knowing funnels, better understanding customer behavior, dramatic improvement in product flow, acquiring customers through content marketing but the returns are stellar. Finally, this takes a lot to stay away from the easy (but expensive and seductive) nature of buying growth through marketing dollars.

Key takeaway - Conversion (%) is not static, if you don't do anything about it - it will eventually fall down!
Metric II - Cost per Lead (CPL)
Definition - defined as the ratio of total marketing spend to TOFU unique customers - measuring this metric gives a sense of how expensive or inexpensive it is for the company to spread the message of its value proposition through any particular paid acquisition channels – like every acquisition channel has a conversion(%), it also has a cost per lead. A combination of CPL and Conversion (%) gives us what is popularly known as Consumer Acquisition Cost (CAC). Essentially CAC = CPL / Conversion (%).
Impact of change in CPL - The importance of CPL metric comes to forefront when the conversion (%) is low. Following math illustrates this point. Let’s assume there are two companies with 20% and 2% conversion rate respectively. Also, let’s assume that both companies operate in a highly competitive market and have witnessed a $10 increase in CPL - essentially competition just bumped up bids on all your key words. For company I with 20% conversion, the delta in consumer acquisition cost is $50 per customer ($10 increase divided by 20% conversion) while for company II with 2% conversion, the delta in consumer acquisition cost is a whopping $500 per customer (how do you recover from this!!). More detailed math can be found here wherein I argue that marketing efficiency is the single most important factor driving growth and burn.
Optimizing the CPL – reducing dependence on paid acquisition channels and pumping efforts into SEO, content marketing, social media marketing is a sure shot way of sustainably reducing CPL. I believe a strong focus on keeping CPL in check (using techniques mentioned above) without sacrificing growth provides for competitive advantage in the short run and also, points to the mettle of the founding team – growing a company on the back of organic acquisition is far more difficult than growing on the back of easy paid marketing.
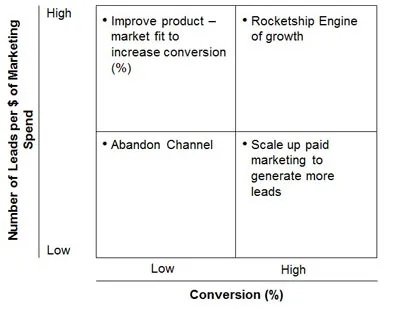
Combination of CPL and Conversion (%) help identify key challenges with acquisition channels- Conversion (%) & Leads generated per $ of marketing spend help identify key levers to pull to improve marketing efficiency of an acquisition channel. The following matrix helps with the same -

A channel with high conversion (%) but low number of leads means that the channel provides for very high qualified leads. High conversion (%) means ability to increase CPL without dramatically altering CAC which means the company should scale up spend on the channel to propel growth (at some stage CPL will go up but high Conversion (%) will take care that CAC doesn’t balloon. Having said that, if it does not play out this way the company needs to find more acquisition channels). Similarly, if leads generated are plenty but conversion (%) is low means either the company is getting low qualified leads or customers are not finding what they are looking for. In the second case, I have seen companies personalize experience based on customer behavior on the website / app to drive higher conversion (%) to drive growth.
If we look at the wildly fast growing companies - Uber, Facebook, AirBnB, Snapchat etc have achieved ‘Rocketship Engine of growth' on the back of viral / organic / word of mouth led customer acquisition. I believe that in order to become a large and valuable consumer internet company this is almost a necessary condition for the simple reason that paid marketing doesn’t scale. There are two reasons I can think of (1) Every channel has limited potential in terms of TOFU customers (2) Paid acquisition channels are open to competition - competitors can easily copy your keyword strategy and bump up bids which can be a disaster if your conversion (%) is low. Don’t get me wrong, I am not dissing paid marketing - at an early stage working with paid channels to get the word out is super important - but this needs to be done in a capital efficient manner (read 'Continuously Optimize Conversion Funnel & CPL') . Having said that, it will be hard (or capital inefficient) to grow to a $100 Mn in revenue only on the back of paid marketing.
Large internet companies are built on the back of organic / word of mouth led acquisition or put in another way paid marketing is extremely hard to scale!
If you are witnessing organic growth with high conversion (%), please call me now!
Metric III - Measuring and optimizing customer loyalty - my curiosity on this subject of measuring customer loyalty piqued when a portfolio company, that I use quite a bit, shared a customer feedback form which was very different from what I had seen before. Over the last 5 years, the company shared a large questionnaire which would take at least 10 mins to complete (if I read every question carefully then it would be like 20 mins) – some of the questions felt repetitive and I had fleetingly wondered how well did this serve them. Cut to this year, and the survey has only ONE question! Which asked me rate on a scale of 1-10, the ‘How likely is that you would recommend ‘company X’ to a friend or colleague’? – I answered it rather thoughtfully and quickly!
Some basic googling led me to a very interesting research published by HBR - ‘The one Number you need to grow’ by Frederick F. Reichheld – the research strongly suggests that companies, across industries, should use only the above mentioned question to measure and optimize customer loyalty! (Yes, just one feedback question!). NPS is measured by subtracting ‘detractors’ (scored between 1-6) from the ‘promoters’ (scored 9-10). The premise being that measuring loyalty on the back of retention (only!) is a good predictor of ‘profitability’ but not ‘profitable growth’ (the dream of every startup!). The research fortifies its suggestion by comparing growth rates of companies within a particular industry – the research found strong correlation between high NPS scores on the above mentioned question and high growth (read ‘seems intuitive now’). Historically, large internet companies such as Amazon and ebay have a score of 70-80% on this survey.
Optimizing customer loyalty – use this survey question to get feedback across product lines, geographical locations, employees and tie the results of the same with incentives. Reach out to detractors to understand pain point and solve for them as soon as possible to drive them into promoters – it’s no news that happy customers are 3x more likely to repeat or refer to other potential customers. ‘Actionable – Auditable - Scalable – Quick to respond – Predictor of Profitable Growth’ – I am pushing this measurement and optimizing effort with every portfolio company.
In conclusion, optimizing conversion (%), CPL and customer loyalty NPS is crucial for sustainable growth (read ‘Capital efficient’ & ‘reducing existential risk’) – this is super important in early stages of a company wherein resources are limited and capital is very expensive. Also, companies need to measure loyalty from a perspective of 'profitable growth' and not 'profitability' alone. Finally, large valuable companies grow beyond paid channels to depend on loyal customers to spread the word of their existence and value proposition.
This article was first published here.
(Disclaimer: The views and opinions expressed in this article are those of the author and do not necessarily reflect the views of YourStory.)


